

Engineering with Multi-Walled Carbon Nanotubes: Material Design, Characterization and Real-World Research
A practical guide to understanding MWCNT powder, interpreting its reported specifications, planning dispersion, reading Raman evidence and evaluating carbon nanotubes for advanced composites, conductive systems and materials research.
Materials engineering is increasingly about designing a network of functions rather than selecting a single ingredient in isolation. A formulation may need to carry electrical current, remain mechanically stable, tolerate processing, maintain its performance over time and fit within a practical manufacturing window. Carbon nanomaterials are studied because their nanoscale structure can create useful opportunities in this kind of design. Multi-walled carbon nanotubes, usually abbreviated as MWCNTs, are one of the material families researchers evaluate for these tasks.
This article approaches MWCNT powder from the perspective of material selection and experimental design. Instead of treating a specification sheet as the whole story, it connects reported dimensions and surface area with the questions that matter during formulation: how the nanotubes are distributed, how their interfaces interact with a host matrix, what analytical evidence can establish, and how a laboratory result can be turned into a repeatable process. The product values below are reproduced as supplied product information, not independently certified measurements. For purchasing or critical technical decisions, always request the current technical data sheet, safety data sheet and batch-specific certificate or test report.
1. What Makes a Multi-Walled Carbon Nanotube Different?
A carbon nanotube can be understood as a tubular structure built from graphitic carbon. In a multi-walled nanotube, several cylindrical graphitic walls are arranged concentrically, one around another. This architecture differs from a single-walled carbon nanotube, which has one principal tubular wall. The term “multi-walled” describes the structure; it does not by itself specify length distribution, defect density, purity, surface chemistry or how well the material will perform in a particular formulation.
At the bulk scale, MWCNTs are often supplied as a dark, finely divided powder. That appearance can make the material seem simple, but the powder is a population of nanoscale structures. Individual tubes can lie alongside one another, form bundles or collect into larger agglomerates. These arrangements can influence wetting, flow, mixing, measured surface area and the development of a connected network inside a polymer or coating. A useful evaluation therefore considers both the characteristics of the nanotubes and the behaviour of the powder as it is handled and processed.
Concentric wall architecture
This 3D-style illustration represents the idea of multiple walls surrounding a central hollow region. It is schematic, not to scale, and is not an electron micrograph of the supplied product.
Multiple graphitic walls
Several carbon walls form a nested tubular structure. The exact morphology and degree of structural order need appropriate characterization.
High aspect ratio
A tube is much longer than it is wide. This geometry can help form pathways at suitable concentrations, although bundling and orientation matter.
Matrix-dependent behaviour
Wetting, surface groups and the surrounding material can influence whether nanotubes disperse and transfer properties effectively.
It is tempting to assume that a material with an impressive nanoscale geometry will automatically improve a finished product. In practice, the host matrix can dominate the outcome. A conductive coating, an epoxy composite and a sensor layer may all require different balances of dispersion, viscosity, interfacial adhesion and electrical connectivity. The useful question is not whether MWCNTs are “good” in general, but whether a documented grade is suitable for the specific design target.
2. Product Snapshot: MWCNT Pure Powder
The following overview organizes the reported product details into a practical selection reference. The dimensions should be treated as nominal descriptors; they do not mean every nanotube in a powder has exactly the same diameter or length. Analytical methods, sampling, instrument settings and reporting definitions can all affect the value that appears on a specification sheet.
| Parameter | Reported value | How to interpret it |
|---|---|---|
| Material form | Black powder | Visual description of the supplied bulk material; appearance alone does not establish purity or morphology. |
| CNT purity | >99% | Reported product value. Ask for the analytical method, calculation basis and batch-specific result. |
| Outer diameter | Approximately 20 nm | Nominal outside dimension; distribution and measurement method should be checked for critical work. |
| Inner diameter | Approximately 15 nm | Reported internal dimension. Confirm how it was measured and defined. |
| Length | Approximately 20 μm | Relevant to aspect ratio and possible network formation, but a distribution is more informative than a single nominal value. |
| Specific surface area | 220 m²/g | Can influence adsorption, wetting, dispersant demand and interaction with the host matrix. |
| Bulk density | 0.16 g/cm³ | Useful for estimating loose powder volume; not the same as the intrinsic density of the carbon material. |
| Metal impurities | <1.5% | Important where residual catalyst metals affect a test, application specification or regulatory requirement. |
| Amorphous carbon | <0.45% | Reported limit for a non-tubular carbon fraction; confirm method and reporting basis. |
| Pack size | 10 g | Pack size listed in the supplied product details; confirm current availability before ordering. |
These figures provide a starting point for technical discussion, not a replacement for qualification. Two suppliers can use the same term for a parameter while measuring it differently. If the project has a narrow tolerance, document the method and acceptance criterion before comparing values. It is also sensible to ask whether a value is a typical result, a guaranteed limit or an individual batch measurement.
3. Translating Specifications into Engineering Questions
Purity is important, but what does the number represent?
A stated CNT purity above 99% may be an important screening detail, yet the meaning of “purity” depends on how the result was obtained. Different analytical methods may quantify different fractions or respond differently to carbon forms and residual inorganic content. For a sensitive application, request the method, the sample identity, the batch result and any relevant detection limits. Avoid assuming that separate impurity limits can be added or subtracted from the purity value unless the supplier confirms that the figures share the same basis.
Residual catalyst metals may matter in some electrochemical experiments, catalytic studies, thermal analyses or systems with strict contamination controls. Non-tubular carbon fractions can also influence how some measurements are interpreted. The appropriate limit is application-specific: the same grade may be acceptable for an exploratory polymer composite study yet require additional evidence for a more tightly controlled research programme.
Diameter and length: a useful starting point, not the full morphology
Length and diameter help describe aspect ratio, but a single nominal number cannot describe a complete powder population. Tubes can vary in length, curve, overlap or arrive in bundles. Processing can shorten or damage structures, while surface treatment can alter the interface and measured response. Where geometry is central to the study, ask whether dimensions were obtained by electron microscopy, how many structures were assessed, and whether the reported number is an average, a range or a representative observation.
Specific surface area and formulation behaviour
The reported surface area of 220 m²/g indicates a large area relative to the mass of the powder. In a formulation, accessible surface can influence how the material interacts with a liquid, polymer, dispersant or other filler. A larger surface area is not universally better. It may increase the amount of dispersant needed, affect viscosity or complicate wetting. The correct objective is not to maximize one number but to achieve the intended combination of performance and processability.
Bulk density and handling logistics
Bulk density describes the mass of powder occupying a volume under a defined packing condition. It may vary with how the powder settles or is compacted, so it should not be confused with the density of the nanotube material itself. The reported 0.16 g/cm³ can help with rough container and volume planning, but it is not enough to design safe powder-transfer procedures. Dust control, container opening, weighing, cleanup and waste management need their own risk assessment.
Specification dashboard
Illustrative visual scales only. The bars are not test plots, quality scores or direct comparisons between different units.
4. Raman Spectroscopy: What Can the Spectrum Tell You?
Raman spectroscopy is a widely used tool for investigating carbon materials. In a Raman experiment, a laser illuminates the sample and a small fraction of the scattered light shifts in energy because it interacts with vibrational modes. The resulting spectrum is typically plotted as intensity against Raman shift, measured in inverse centimetres (cm⁻¹). For graphitic carbon materials, the D and G bands are commonly discussed; other features, including the 2D band, can also provide useful information depending on the material.
The G band is associated with in-plane vibrational modes of sp²-bonded carbon. The D band is often described as defect-activated: its response can be influenced by disorder, edges and structural features that affect the scattering process. In graphene and graphite studies, the 2D band is often informative about layer-related structure. In nanotubes, the spectrum can also depend on tube structure, excitation conditions, resonance effects, sample preparation and the particular population being measured.
D band
Often used when discussing disorder-related or defect-activated features in sp² carbon. Its interpretation depends on the material and measurement conditions.
G band
Associated with in-plane vibrational modes of graphitic sp² carbon and commonly considered alongside the D band.
2D and other features
Additional bands can contribute structural information, but their meaning differs across graphite, graphene and nanotube systems.
Why the D/G ratio is not a universal grade score
Researchers sometimes report the intensity ratio of the D and G bands as one way of comparing carbon materials. However, that ratio is not a universal purity percentage or a pass/fail number. Its interpretation depends on excitation wavelength, baseline correction, peak-fitting method, material type, structural regime and other experimental factors. The same apparent ratio can be misleading if spectra were collected or processed differently.
For a meaningful comparison, record the laser wavelength and power, acquisition conditions, sample preparation, baseline treatment, fitting method and the precise definition of intensity used for the ratio. If the goal is to assess a treatment, compare untreated and treated samples using a consistent protocol. Interpret Raman alongside other evidence rather than treating one peak or ratio as a complete description of the material.
Raman is powerful because it can be comparatively quick and can reveal useful structural signatures, but it has limits. It does not independently establish every parameter a buyer may care about, such as the complete size distribution, the exact concentration of every impurity, long-term dispersion stability or performance in a finished composite. A well-designed characterization plan combines techniques chosen to answer specific questions.
5. Graphite, Graphene and MWCNT: Choosing the Right Carbon Form
Graphite, graphene and carbon nanotubes share a graphitic carbon basis, but their geometry differs. Graphite consists of many graphitic layers stacked together. Graphene is commonly described as an individual atomic layer in an idealized structure. A carbon nanotube is tubular; a multi-walled nanotube contains several nested graphitic walls. The differences affect how the materials pack, connect, interact with matrices and are characterized.
| Material | Structural picture | Typical research questions | Selection considerations |
|---|---|---|---|
| Graphite | Stacked graphitic layers | Layered carbon behaviour, electrodes, lubrication and bulk properties | Particle size, orientation, grade and processing route can influence results. |
| Graphene | One atomic layer in the idealized form | Electronic, thermal, mechanical and surface-related behaviour | Layer count, defects, contamination and production method matter. |
| MWCNT | Multiple concentric graphitic tubes | Conductive pathways, reinforcement, sensing and composite development | Length, diameter, bundling, dispersion and interface quality matter. |
There is no universal winner across all applications. A platelet-shaped material and a tube-shaped material can form different kinds of networks, while the host matrix and manufacturing method may strongly affect the final result. Selection should follow the target property, available processing equipment, acceptable loading, safety requirements and validation method. When comparing materials, evaluate them under comparable formulation and test conditions wherever possible.
6. Product Media: Powder Appearance and Packaging
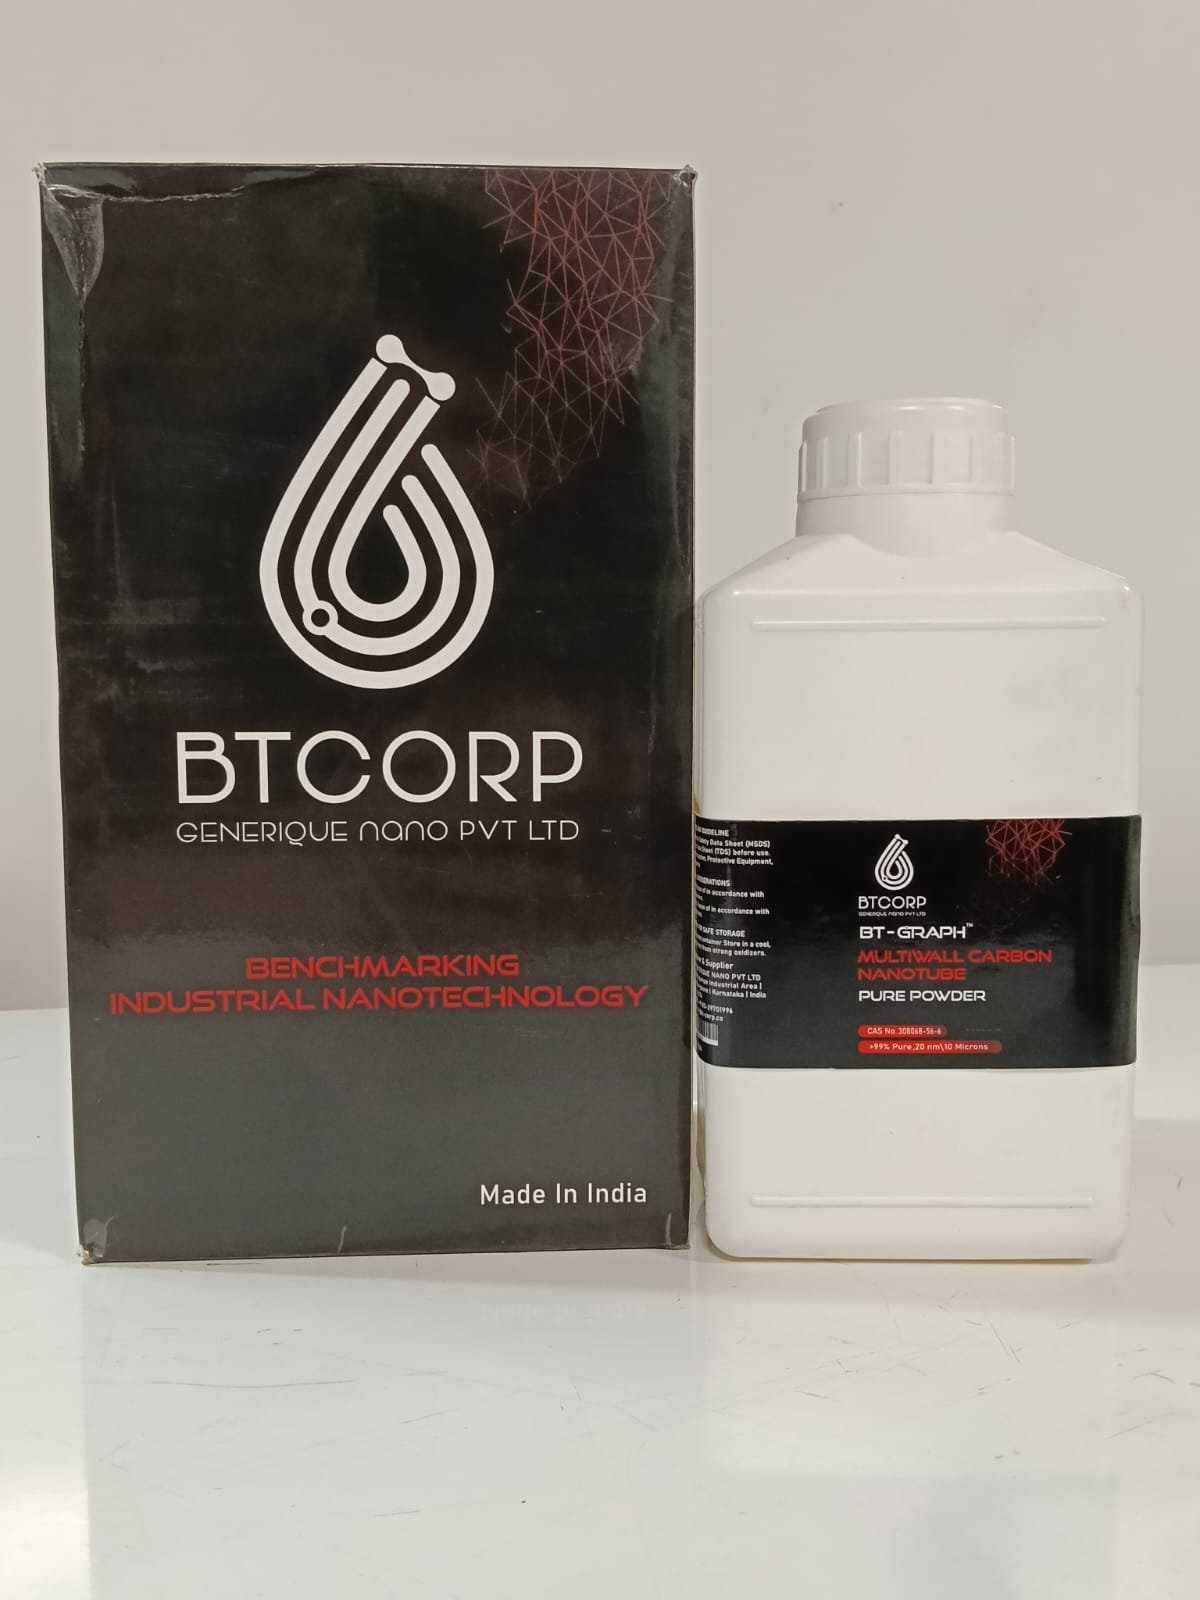
The product photographs below show the supplied MWCNT Pure Powder packaging and material appearance. Photographs can help identify the product presentation, but they cannot establish nanoscale dimensions, purity, electrical properties or dispersion quality. Those questions require documented specifications and suitable testing.
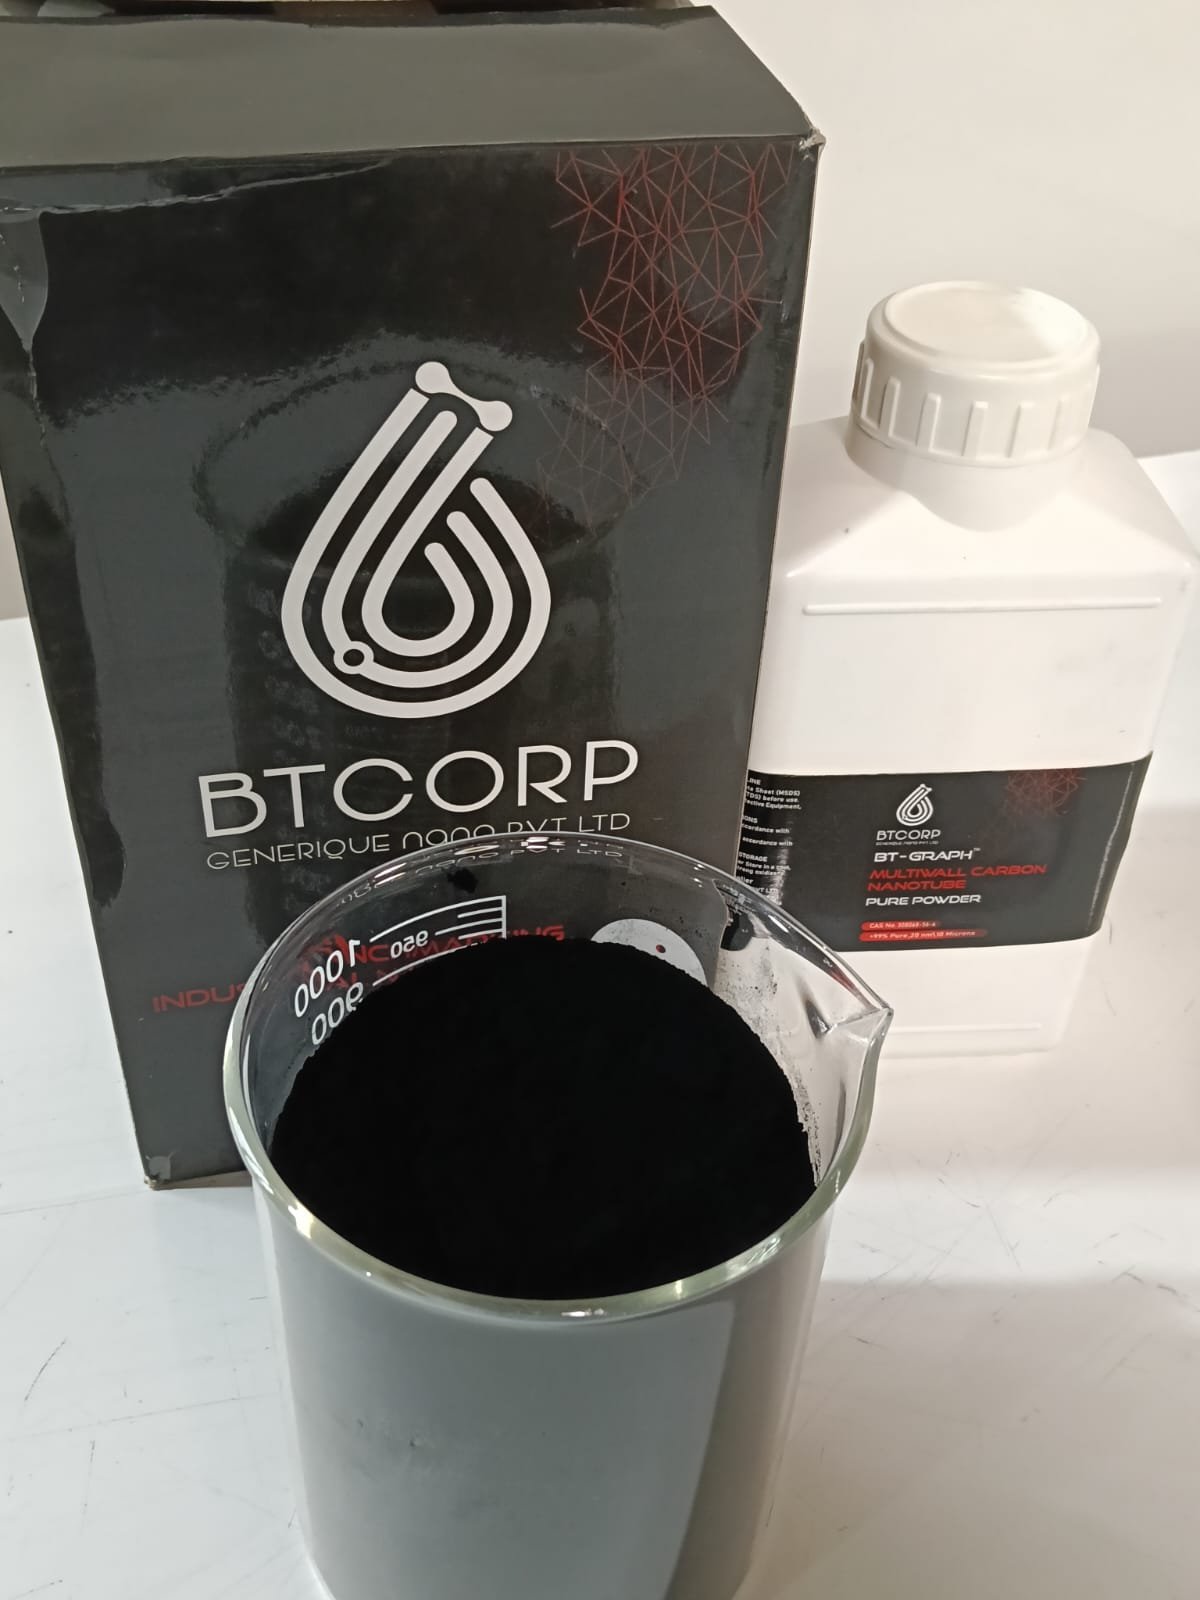
For a technical product page, media works best when it supports the written explanation rather than replacing it. A product photo can identify the packaging; a video can show the material or container from another angle; a specification table communicates numerical values; and a laboratory report supports claims that cannot be verified visually. Keeping those roles distinct improves clarity and reduces the risk of implying that a photograph proves a technical property.
7. Where MWCNTs Are Investigated
MWCNTs are studied across a range of material-development areas. Their potential value depends on whether their geometry, surface chemistry and interaction with the host system can produce the required outcome. The application examples below are research directions, not guarantees that every grade is suitable for every listed use.
Conductive polymers and coatings
Researchers evaluate nanotubes as conductive fillers that may form connected pathways through a polymer, ink or coating. Network connectivity and dispersion are key variables.
Epoxy and composite systems
MWCNTs may be assessed as functional fillers where mechanical response or electrical behaviour is being engineered. Cure chemistry, viscosity and interface quality require attention.
Sensors and electronics
Carbon nanotube networks are explored in sensing layers and conductive structures. Repeatability, substrate compatibility and signal stability must be tested.
Energy-storage research
Carbon nanomaterials are investigated in electrode formulations and conductive networks. Electrochemical compatibility and impurity requirements must be validated for the specific system.
EMI shielding materials
Conductive composites may be studied for electromagnetic interference shielding. Performance depends on frequency, thickness, geometry and formulation.
Hybrid nanomaterials
MWCNTs can be combined with polymers, oxides or other materials to investigate functions that are not provided by a single component alone.
For each application, define the performance target before selecting a grade. A conductive formulation may be evaluated by volume or surface resistivity under a documented method. A mechanical composite may require tensile, flexural or impact testing against an unfilled control. A sensor study may prioritize response, recovery, drift and repeatability. An EMI material needs testing across a defined frequency range and sample geometry. The method should match the claim being made.
From material choice to validated performance
Think of MWCNT selection as a connected workflow: specification → formulation → characterization → application test → repeatability check. Each step answers a different question. Skipping a stage can make a promising early result difficult to reproduce or scale.
Material fitDispersionTestingScale-up8. Conductive Networks and the Percolation Concept
In many conductive composites, nanotubes must connect sufficiently to create a pathway through the host material. This is often discussed using the concept of a percolation threshold: a concentration range in which a connected network begins to produce a marked change in electrical behaviour. It is not a universal fixed concentration. It varies with the nanotube geometry, degree of agglomeration, orientation, surface treatment, matrix chemistry, mixing route and measurement method.
At a low loading, the formulation may retain more of the base polymer’s original flow or mechanical characteristics, but the conductive network may be incomplete. Raising the loading can improve connectivity in some systems while also increasing viscosity, complicating dispersion, changing mechanical behaviour or raising cost. The design objective is to find a workable balance rather than automatically maximizing nanotube content.
Processing history matters. A high-energy mixing step may break up agglomerates but can also introduce heat or, under some conditions, shorten structures. A dispersant may improve wetting yet interfere with electrical contacts or cure behaviour. A functional group may improve compatibility with a matrix but alter the carbon structure or electronic response. These trade-offs should be tested rather than assumed.
Define the target
Choose the property and acceptable range before preparing samples.
Plan the formulation
Select the matrix, grade, loading range and mixing conditions.
Measure the outcome
Use repeatable tests and compare against an appropriate control.
Validate repeatability
Repeat promising conditions and check whether results survive scale-up.
Record formulation mass, order of addition, mixing equipment, mixing time, energy input where available, temperature, rest time, sample conditioning and test geometry. Without these details, two samples described as having the same percentage of MWCNTs may not be meaningfully comparable. A controlled experiment makes it easier to identify whether a change in performance came from the material, the processing route or the measurement procedure.
9. Dispersion: Why Powder Behaviour Changes the Result
Nanotubes can interact with one another and form bundles or agglomerates. Dispersion aims to distribute them through a liquid or solid matrix at a scale suitable for the intended function. A mixture that looks visually uniform is not necessarily free of nanoscale bundles, nor does it prove long-term stability. The right evaluation depends on the formulation and may include microscopy, rheology, sedimentation observations, conductivity measurements or other application-relevant methods.
In a liquid formulation, solvent choice, dispersant chemistry, solids concentration, mixing sequence and energy input can influence the result. In a polymer melt or reactive resin, viscosity and cure conditions may restrict the available process window. A pre-dispersed product may simplify some initial wetting steps, but its carrier, concentration, shelf stability and compatibility still need to be confirmed. The supplied product information states that dispersions may be available in water, IPA (isopropyl alcohol), DMF, butyl acetate and other organic solvents; confirm the precise formulation and current availability with the supplier.
Questions to answer before a dispersion trial
- What is the intended medium: water, an organic solvent, a resin, a polymer melt or another host?
- What solids concentration and viscosity can the downstream process tolerate?
- Could a dispersant affect conductivity, curing, adhesion, surface finish or another target property?
- What equipment and mixing intensity are appropriate, and how will temperature be controlled?
- How will uniformity, sedimentation, agglomeration and storage stability be assessed?
- What controls are needed for powder exposure, solvent handling and waste disposal?
For a reliable development programme, use a controlled trial plan with a baseline formulation. Change one factor at a time during early screening where practical, or use a structured experimental design if several variables must be investigated together. Document failures as well as successful conditions: a formulation that becomes too viscous, settles rapidly or loses performance during storage provides useful information about the limits of the system.
Functionalized MWCNTs
The supplied product details also mention functionalized variants, including carboxyl (-COOH), hydroxyl (-OH), amine (-NH₂) and other custom surface groups. Functionalization can change the interactions between a nanotube and its surrounding medium. That may improve compatibility in one formulation, but it can also change conductivity, defect-related signatures, thermal response or other properties. The right surface chemistry is the one that supports the required combination of processing and end-use performance, confirmed through tests on the actual system.
10. A Characterization Plan That Uses More Than One Method
No single instrument gives a complete description of an MWCNT powder. A robust plan starts by identifying the decision that needs to be made and then choosing techniques that answer it. Raman spectroscopy can help compare carbon bonding features and disorder-related signatures. Electron microscopy can reveal morphology and bundles in the imaged regions. Surface-area measurements estimate accessible area under a defined method. Elemental analysis can address selected impurities. Thermal analysis can describe mass change or thermal response under specified conditions. Application tests establish whether the material performs in the intended matrix or device.
| Method / evidence | Potential contribution | Questions to ask |
|---|---|---|
| Raman spectroscopy | Carbon structure features and comparisons related to disorder | What laser wavelength, power, baseline and fitting method were used? |
| SEM / TEM | Visual evidence of morphology, dimensions and agglomerates in sampled areas | How were fields selected, and how many structures were measured? |
| Specific surface area | Estimate of accessible surface under the measurement conditions | What preparation and analysis method were used? |
| Elemental / metal analysis | Information about selected elements or residual metals | Which elements, detection limits and reporting basis are included? |
| Thermal analysis | Mass-loss and thermal-response information under defined conditions | What atmosphere, heating rate and sample mass were used? |
| Application testing | Direct evidence of behaviour in the target formulation or device | Does the test reproduce actual use conditions and acceptance criteria? |
When comparing suppliers or batches, compare like with like. A value without its test method may not be directly comparable with a value obtained by a different procedure. Ask whether results are typical or batch-specific, and whether the sample preparation is documented. For important work, preserve retained samples where practical and define how a future batch will be checked against the original acceptance criteria.
Characterization should also be proportionate. A preliminary academic screening project may begin with a smaller evidence package, while a tightly controlled production process may require more comprehensive documentation and repeatability data. The essential principle is to avoid using a method to support a claim it was not designed to establish.
11. From Bench Experiment to Industrial Development
A formulation that works in a small vessel may behave differently at a larger scale. Equipment geometry, heat transfer, shear distribution, residence time and addition sequence can change as batch size increases. For that reason, scale-up should be treated as a validation stage rather than a simple multiplication of ingredient quantities. A disciplined workflow helps reveal which parameters need tighter control before moving to production-scale equipment.
Material review
Confirm product identity, documentation, specification limits, intended use and handling requirements.
Bench screening
Test a controlled range of formulations and record mixing conditions and sample preparation.
Performance validation
Measure the properties that define success and compare with a suitable baseline or control.
Scale-up readiness
Review repeatability, processability, quality checks, storage behaviour and practical operating limits.
Before a scale-up trial, agree on the variables that must remain controlled. Depending on the system, these might include loading, mixing energy, temperature, residence time, batch order, curing conditions, film thickness or sample conditioning. Determine which variables can be monitored directly and which require indirect indicators. Then define the tests that will determine whether the larger batch is equivalent to the successful laboratory formulation.
The supplied product information states that custom particle specifications, concentrations and packaging may be available on request, and that bulk quantities and technical support are offered for research and industrial requirements. Confirm current options, minimum quantities, lead times and the scope of support directly with the manufacturer. When making an enquiry, a concise technical brief is more useful than a general request: include the target application, matrix or solvent, desired performance, estimated quantity, impurity constraints and required documentation.
12. Common Mistakes in MWCNT Evaluation
Mistake 1: Treating nominal purity as a performance guarantee
Purity is one part of material selection. It does not independently establish dispersion, conductivity, mechanical performance, long-term stability or compatibility with a specific resin. Validate the complete formulation against the intended application.
Mistake 2: Comparing Raman plots without checking the method
Excitation wavelength, laser power, sample preparation, baseline correction and peak-fitting choices can influence the appearance and reported ratios. Document these conditions and use consistent analysis for meaningful comparisons.
Mistake 3: Assuming that more nanotube loading is always better
Increasing loading can improve one target property but may increase viscosity, complicate mixing or change mechanical behaviour. A controlled loading study is more informative than assuming the highest concentration is best.
Mistake 4: Equating a visually uniform mixture with a stable dispersion
Visual inspection is useful but limited. Establish an observation period and choose appropriate measurements for sedimentation, agglomeration and functional performance.
Mistake 5: Ignoring batch traceability
Record product identity, batch number, material mass, formulation, mixing conditions, test method and results. Traceability is essential for reproducing successful trials and understanding differences between batches.
Mistake 6: Making a product claim that the evidence does not support
A photograph does not prove purity; a schematic diagram is not a micrograph; an illustrative Raman curve is not a test certificate; and a promising laboratory result is not a guarantee of commercial performance. Match every technical claim to the evidence that supports it.
13. Safe Handling, Storage and Responsible Use
Fine carbon nanomaterial powders require thoughtful handling. Avoid generating airborne dust, use appropriate containment and ventilation, and follow the supplier’s current safety data sheet and the workplace risk assessment. The correct engineering controls and personal protective equipment depend on the task, quantity, exposure potential, product form and applicable rules. A general article cannot replace product-specific safety instructions.
Keep containers closed when they are not in use, use suitable tools for weighing and transfer, and avoid cleanup methods that could disperse dust into the air. Establish spill-response and waste procedures before opening the package. If a liquid dispersion is used, evaluate the hazards of both the nanomaterial and the carrier; solvent flammability, ventilation, chemical compatibility and waste requirements may be relevant.
Store the product in a suitable, labelled and closed container under the conditions specified by the supplier. Prevent unintended contamination and follow any instructions relating to moisture, temperature or storage duration. Check the label and accompanying documentation before use. Where work involves biological systems, people or regulated products, additional risk assessment, testing and approvals may be required. The supplied product information identifies the material for laboratory, research, industrial R&D and product-development use and states that it is not intended for pharmaceutical or food applications.
14. How to Select a Grade for a Specific Project
Start with the outcome rather than a single specification. If the goal is electrical conductivity, define the target range, sample geometry and test method. If the goal is reinforcement, determine which mechanical property matters and how it will be measured. If trace impurities are important, define the limits and required analytical evidence. If a formulation must remain pumpable or sprayable, viscosity and process compatibility may be as important as the final material property.
| Project type | Information to prioritize | Possible validation direction |
|---|---|---|
| Conductive polymer | Dispersion, loading range, matrix compatibility and electrical target | Measure conductivity or resistivity using a defined geometry and method. |
| Epoxy composite | Viscosity, wetting, cure compatibility and mechanical target | Compare cured specimens against an unfilled control. |
| Sensor development | Signal response, repeatability, substrate and environmental stability | Test multiple samples under controlled conditions and track drift. |
| Energy-storage research | Impurity limits, electrode compatibility and electrochemical protocol | Use application-specific tests with documented controls. |
| Coating / EMI material | Film formation, thickness, dispersion and target frequency range | Test the finished layer under an agreed method and geometry. |
A supplier enquiry can include the host matrix or solvent, target property, intended process, expected quantity, impurity limits, desired format and test requirements. If considering a functionalized or pre-dispersed option, specify the required surface chemistry or carrier and ask for compatibility information. This approach creates a clearer conversation about fit and documentation than asking only whether a powder is “high quality.”
15. Frequently Asked Questions
What does MWCNT stand for?
MWCNT stands for multi-walled carbon nanotube: a tubular carbon nanostructure with multiple concentric graphitic walls.
What purity is reported for this MWCNT powder?
The supplied product information reports CNT purity above 99%. For critical work, request the current batch-specific documentation and the analytical method used.
What dimensions are listed?
The supplied details list an approximate outer diameter of 20 nm, inner diameter of 15 nm and length of 20 μm. These are nominal descriptors, not a statement that every nanotube is identical.
What is the stated specific surface area?
The product details report 220 m²/g. Confirm the method and sample preparation when comparing this figure with another grade.
Can MWCNTs be evaluated in polymers or epoxy?
Polymer and epoxy composites are among the stated application areas. Suitability depends on resin chemistry, loading, dispersion, processing conditions and measured performance.
Are dispersions or functionalized versions available?
The supplied information states that dispersions in selected solvents and functionalized variants may be available. Confirm the exact carrier, concentration, surface group, current availability and documentation with the supplier.
What does Raman spectroscopy prove?
Raman spectroscopy can provide information about carbon structure and disorder-related signatures. It does not independently prove every specification or predict finished-product performance.
Can an illustrative spectrum be used as a certificate of analysis?
No. A schematic graphic is explanatory only. Use an actual report with documented sample identity, method and test conditions for qualification decisions.
Is the material intended for food or pharmaceutical use?
The supplied product note identifies the material for laboratory, research, industrial R&D and product development, and states that it is not intended for pharmaceutical or food applications.
Who is identified as the manufacturer?
The supplied product information identifies BTCORP Generique Nano Pvt Ltd. as the manufacturer. Confirm current product and batch details directly with the supplier.
16. Conclusion: Build the Evidence Around the Application
Multi-walled carbon nanotubes are a useful platform for research into conductive networks, functional composites, sensing structures, coatings and other advanced materials. Their potential comes from a combination of nanoscale geometry, graphitic carbon structure and surface interactions, but those features do not guarantee a particular result in every host system. Application performance emerges from the material, its dispersion, the matrix, the processing route and the way the final property is measured.
The supplied specification set for MWCNT Pure Powder lists CNT purity above 99%, an approximate outer diameter of 20 nm, an approximate inner diameter of 15 nm, an approximate length of 20 μm, specific surface area of 220 m²/g, bulk density of 0.16 g/cm³, metal impurities below 1.5%, amorphous carbon below 0.45% and a 10 g pack size. These details are a useful starting point for technical discussion. For formal selection, confirm current documentation, methods, batch-specific results and safety information.
Raman spectroscopy can contribute meaningful evidence when its bands and ratios are interpreted in context and compared using consistent procedures. Microscopy, surface-area analysis, elemental testing, thermal analysis and application-level measurements answer complementary questions. In formulation work, disciplined dispersion trials and controlled validation help turn a promising material into a reproducible component. The most reliable path is to define the goal, document the method, measure the outcome and confirm repeatability before scaling up.
Technical takeaway
Choose the grade for the application, not for a headline number alone. Confirm the specifications, understand the test methods, plan safe handling, validate the formulation and keep batch records so the result can be reproduced.
15. Designing a Repeatable Experimental Programme
A useful MWCNT study is designed so that another researcher can understand what was changed, what was held constant and why a conclusion follows from the measurements. This may sound like basic laboratory practice, but it becomes especially important when the outcome depends on several coupled variables: powder characteristics, dispersion conditions, matrix chemistry, sample geometry and test environment. A clear experimental plan helps separate the effect of the nanotube grade from the effect of processing.
Establish a baseline before changing the formulation
Begin with a control sample that represents the host matrix or existing formulation without the added MWCNTs, where that comparison is appropriate. Record its preparation route and measure the property that matters to the project. The control provides a reference for deciding whether the new formulation has produced a meaningful change. If the control varies substantially between batches, the study may need to improve its base process before conclusions about the nanomaterial can be reliable.
Choose variables and responses deliberately
Possible variables include nanotube loading, mixing time, mixing intensity, dispersant concentration, order of addition, curing conditions and sample conditioning. Responses might include electrical resistivity, viscosity, mechanical strength, sedimentation, surface appearance or signal stability. Avoid collecting many measurements without deciding how they relate to the research question. Define the primary response first, then identify supporting measurements that can help explain why a result occurred.
When only one factor is changed at a time, interpretation may be straightforward during early screening, but this approach can miss interactions between factors. For example, the best mixing intensity may depend on the loading level, and the preferred dispersant amount may depend on the solvent. When several variables are expected to interact, a structured design of experiments can help explore the space efficiently. The design should remain appropriate to the available equipment, sample quantity and level of uncertainty.
Replicates, uncertainty and reporting
Repeat measurements help distinguish a consistent effect from a result caused by sample-to-sample variation or measurement noise. The number of replicates should reflect the importance of the decision, the variability of the method and practical constraints. Report how many independent samples were prepared, not only how many times one sample was measured. Repeated readings on a single specimen can characterize instrument repeatability but may not capture the variation introduced during mixing or sample preparation.
Keep raw data and document any exclusions, corrections or unusual events. If a measurement appears inconsistent, investigate the preparation and instrument records rather than deleting the result without explanation. Report units, sample conditioning, test geometry, environmental conditions and calculation methods. For Raman data, include the excitation wavelength and relevant processing details; for electrical tests, specify the measurement arrangement and contact method; for mechanical tests, document specimen preparation and the applicable method. Clear reporting makes comparisons more meaningful and gives later researchers a route to reproduce the result.
Use decision gates before scaling up
A practical project can use decision gates at the end of material review, screening, validation and scale-up. At each gate, decide what evidence is sufficient to continue, what issues remain unresolved and what result would cause the team to stop or reformulate. A formulation should not advance simply because it produces one attractive measurement. It should also be processable, safe to handle under the intended controls, compatible with downstream equipment and repeatable enough to justify the next investment of time or material.
Finally, preserve the distinction between a laboratory observation and a validated product claim. A preliminary improvement in one test is a reason to investigate further, not proof that the same improvement will occur in every matrix or production line. Claims should reflect the actual conditions tested and the limits of the evidence. This disciplined approach protects the quality of the research and helps technical teams communicate findings accurately to colleagues, suppliers and customers.
Product information and media shown here are for technical and educational context. Verify current specifications, availability, intended-use limits and safety documentation with BTCORP Generique Nano Pvt Ltd. before making a purchasing, research or manufacturing decision.